We needed to choose some wall & floor tiles when we bought our last new house. The builder worked with a local tile shop & we were sent there to make our selections. We spent several hours driving ourselves nuts. We were totally frustrated & depressed when we left. After three hours, the staff were relieved to see us go. And we still hadn’t chosen anything! Worse, we’d left the store in a mess. Tiles were spread across half the showroom floor. There were so many to choose from, we just couldn’t make up our minds. I called the store next morning & asked them to lay out about a dozen choices that were mainly black & charcoal. We went back & made our selections from the samples laid out. And we were on our way within ten minutes. Job done. Once we’d decided on a general colour theme, limiting the choices made it far easier to choose.
Investing can be a bit like that for new investors. There are too many choices. Should you invest in stocks or ETFs? For just about all beginning investors, the better choice is ETFs. But, on the Canadian exchange, I think there are more ETFs than stocks now. So which ETFs should you invest in? There are actively managed funds & those that passively track market indices or broad markets. Since, after fees, most professionals can’t beat broad market & index funds, most of the time, the correct answer for most of us is broad market or index funds. Now you are down to the black & charcoal tile scenario! All you’ve got left to do now is figure out which market funds to go with. Fortunately, the fund providers have made this easy for us these days. Not only have they reduced the selection of tiles we need to look at, they’ve put them all in one shopping cart for us.
Many fund providers in Canada offer a globally diversified basket of market index funds that cover the US, Canadian, developed, & emerging markets. The big three providers in Canada, Blackrock, BMO, & Vanguard, offer XEQT, ZEQT, & VEQT, respectively, for this very purpose. You still have to choose one. But the good news is that it doesn’t matter which one you choose, they’re virtually identical. If you want to feel better about it, choose one for your TFSA & a different one in your RRSP. Draw your choices out of a hat, if you like. You are now invested in broad market index funds across the globe. Make your initial investment in these funds & continue to add to them with every paycheque. Job done!
The online noise might suggest you do something differently. For example, the S&P 500® funds, like Vanguard’s VFV, have done phenomenally well for the past decade or more. The American market has crushed the competition. Investors are drawn towards whatever is doing well. That drives the price up. To be fair, there are worse things you could do than get into the US market. AI has a lot of allure these days, for example. However, it is worth remembering the lessons of history. If you’d invested in an S&P 500® fund back in 2000, you’d find yourself with about the same amount in your portfolio after ten years. Yes, today’s hot index created no wealth for a full decade back then. While the Canadian index about doubled over that same period. The Japanese market tumbled from its all time high in 1989. It took 34 years to get back to that high. Even “good” broad market indices can sometimes hurt if you take a narrow focus. Especially over shorter timelines. These global equity funds have all the markets. Including an overweight to the American market. You’re not missing out on what the American market offers, you are just diversifying more. The American market may continue to outperform. But that is still a narrow bet, with an uncertain outcome. Warren Buffett has the confidence & skill to go in harder on more winners than losers. And he loves the American market. But he tends to think in far longer investing timelines than the rest of us. These equity funds are globally diversifed. Diversification is considered the only free lunch in the investing world. And this global approach is a good investing appetiser for a novice investor.
Look, you might not shoot the lights out with one of the above funds. Or at least, not quickly. But you might have a decent chance of growing your wealth over time. Start out this way until you learn more. And when you learn more, you might even decide this is still the best approach for you. Trying to pick the winners, either stocks or narrowly focused ETFs, or trying to pick next year’s winning market, depends more on luck. And good luck with that!
If you invest in one of these funds, & if you continue to add to your investment with a little piece of every paycheque, you’re still not out of the woods. Because your investment will tumble anyway. It’ll go down 5% regularly, but it can also crash 10 or 20%, from time to time. Maybe even 50% or more on rare occasions. What will you do when that happens? What you should do is keep on investing your regular contributions. Buying more of the good stuff when it’s on sale will help grow your long-term wealth even more. Those periodic tumbles are a natural part of the process. Investing is a long game. If you are 30 today, you have 35 years to go to retirement at 65. You might have another 30 years of retirement to get through. That’s a 65 year investing timeline. Historically, the longer the investing timeline, the lower the risk of loss. But the risk of volatility is always with us on the journey. And it’s tough to weather short-term volatility. That’ll be one of the most challenging lessons to learn along the way. While past performance has no bearing on what the future might hold, it’s all we’ve got to go on. Markets have always recovered & gone on to new highs. And if we ever reach a point where global markets fail to grow over time, we’ll have a whole other set of problems that our investments likely won’t fix. Instead of an emergency fund, we’ll need a farm in the wilderness!
Investing is tough, but these globally diversified funds make it easier to get started. And for young investors, getting started early is important. The best education comes from having something invested. And with these funds, you won’t be paralysed trying to choose something from everything available. Because you’ll have a little bit of everything in your shopping cart.
The tiles turned out great, btw!
If you want to learn more about saving & investing from the ground up, I’d like to suggest that you check out Double Double Your Money, available at your local Amazon store.
Important – this is not investing, tax or legal advice, it is for entertainment & conversation-provoking purposes only. Data may not be accurate. Check the current & historical data carefully at any company’s or provider’s website, particularly where a specific product, stock or fund is mentioned. Opinions are my own & I regularly get things wrong, so do your own due diligence & seek professional advice before investing your money
I’m jumping the gun on this one, but I’m so excited to have stumbled across this financial planning tool that I want to share it with you now. Funny enough, Microsoft’s Copilot chatbot introduced me to this. I asked Copilot to help with a financial plan & after providing some insights & encouragement, the first link it provided was to planeasy.ca. This led me to their financial planning platform adviice.ca. While I’ve only played with it for a few hours yet, I’m really excited about what these guys are doing. And what this platform can do for DIY investors who are also doing DIY financial planning.
One of the drivers for DIY investors to do the DIY thing is our frugal nature. We want to save on investment & advisory fees so that we keep more of our money. That may, or may not, work out well for us, but we just can’t escape the desire to be frugal. This frugal nature also extends to financial planning. Though many DIY investors recognise the value of a financial plan, we tend not to want to pay the fee for having a plan done professionally. And no wonder, it’s not difficult to find fees in the two to five thousand dollar range for having a single financial plan prepared by a professional. Despite the value, that’s still a lot of coin for a one-shot deal. I’m not sure what plan revisions would cost in subsequent years, but it’s fair to assume that as time goes by & circumstances change, it probably makes sense to have the plan updated periodically.
If you’ve watched YouTube® videos on financial planning, you’ll have seen them use software for those sexy charts & graphs that are easily modified for viewing different scenarios. We know we want this, but the software isn’t available to non-professionals in many cases. And some of us are unwilling to pay the price for the professional to do a plan. The Adviice.ca platform costs $9 for a 30 day trial. And $9 a month if you decide to keep the subscription. At these prices, that’s almost 28 years of DIY financial planning for the same cost as one $3,000 plan! There are so many threads to weaving an accumulation or retirement plan. It is very difficult to do it on a notepad or with spreadsheets. Adviice does the calculation grunt work in the background & shows the results in an easy-to-read visual format. It’s also updated to reflect current details on taxation, government income streams, etc. At this point, I haven’t played with the platform for long enough to write a review. Frankly, I’m not qualified to do a real review anyway. The best I could do is provide a DIY appraisal of what I’ve found. However, this post is more about my early enthusiastic reaction to finding it & using it.
Within 2 hours of signing up for this platform, I had a rough-tuned retirement plan done. Much of that time was spent inputting the foundational data. It took another couple of hours to learn enough about how it worked to improve on the first pass. This particular plan embraces a situation that covers another three or four years of working, reviewing different RRSP drawdown strategies, looking at the tax implications of different withdrawal rates across different account types, & so on. I still have much to learn & a lot of fine-tuning to do, but I think I’ve got a pretty respectable financial plan pulled together already. Now the beauty of this is that you can spend as long as you want fine-tuning a plan. Or, to avoid the law of diminishing returns, you can book a one hour session with an advisor at Planeasy, or with other professionals using the platform. You can do this right within the Adviice platform. And for only $499! Or you can book a more comprehensive package for $1,999.00, which could include multiple retirement scenarios, additional tuning sessions, etc. The beauty of this offering is that you can do the DIY thing at a low cost, but then you can add some professional assessment at a lower price than the typical financial planning service might cost. Along with pandering to the hands-on thing favoured by many DIY folk, this could be a cost-effective combination of DIY & professional advice.
Rather than share screenshots, which won’t capture the full scope of what this platform really does, here’s a link to a PlanEasy YouTube® video that covers one example of doing a retirement plan for a couple. It captures a lot of the features & functionality of the system. If you’ve watched financial planning videos in the past, you’ll find a lot you can relate to in this. This clip shows the software with the green PlanEasy branding, mine has the blue Adviice branding, but is otherwise identical. Though there may be some additional features on the latest version. It’s not yet a perfect solution for all scenarios. I’d like to try scenarios where I pass away earlier than my spouse, for example. You can work around most of these limitations by manually adjusting the data columns, but it looks like they are working on improving the functionality & adding features on an ongoing basis. I joined their Reddit® group (r/adviice) where you’ll see feature requests & the company’s responses to these. They are really quick to respond to questions.
The biggest limitation to the client version that I’ve seen, so far, is that we can only create one foundational data set. In other words, short of starting over, we can only do our own plan, for a single or a couple. And that’s fair enough. The advisors pay more & can obviously prepare plans for multiple clients. For those who take advantage of a session with an advisor, the advisors can then use our base plans to add their professional input on top of ours. I guess part of the reason we can get the lower cost professional oversight is because we have already done the work to build the foundational data set. We can still, however, create multiple scenarios based on our own foundational data set. That allows us to explore different accumulation & withdrawal strategies, & so on. The other limitation is that we cannot create reports. Those are delivered to us after a session with an Adviice advisor. That too is fair. It would be possible to change the foundational data to create reports for others if this was open. Just doing the DIY thing for ourselves, we can get all the relevant info right on the screen. And we can export the plan’s data, for those who want to play with the numbers in a spreadsheet. The reports are not essential for getting value from this software.
Bottom line is that I think this is the first affordable solution that is accessible for Canadians who want to be more involved in creating their own financial plan. Not only is it more affordable to begin with, but it may offer access to professional planning & fine tuning at a more affordable price too. It is a really smart product approach from this company. I think they will find many takers at $9 a month that might otherwise never have spent a penny on financial planning. And I think many of those takers will avail of the tune-up sessions with a professional advisor. And there will be those who will take advantage of the larger, more comprehensive professional support packages too. I hate this way-overused phrase, but this product has all the feel of one of those really good win-win solutions!
If I’m sounding like I work for these guys, I apologise, but I have absolutely no affiliation. I found it last weekend & I ponied up the $9 within 10 minutes of reading about it. Within an hour of playing with it, I knew this was going to be an enjoyable experience. When I compare the number of hours I spend with calculators & spreadsheets trying to do all this, Adviice is a great option for me. However, learning anything new does require some brain activity. And it might not be suitable for everyone. Of course, we all know that we need to challenge our brains as we age. And learning to use this will certainly exercise the brain. In my case, that might be a bonus! 😜
Despite my enthusiasm, I would also strongly caution against using this as the total solution to a problem that you might not fully understand. If you don’t know enough to have confidence in your current DIY financial plan, you might not know enough to understand if the results produced by Adviice are good enough to live by. Particularly when it comes to depending on a plan that needs to survive your retirements years. I know I’ll enjoy playing & refining a plan with these tools going forward. But I will also take advantage of a one hour session with a professional down the road. Just in case I’ve screwed it up. Please be careful here! It may turn out that this product is not suitable for you. But if you enjoy doing this kind of thing, & if you are spending a lot of time with spreadsheets & online calculators, I highly recommend investing the $9 to test drive it.
While I have focused on the older demographic in the course of this conversation, this is also of potential value for the young accumulator. At long last, there is almost an app for this stuff! LOL
If you want to learn more about saving & investing from the ground up, I’d like to suggest that you check out Double Double Your Money, available at your local Amazon store.
Important – this is not investing, tax or legal advice, it is for entertainment & conversation-provoking purposes only. Data may not be accurate. Check the current & historical data carefully at any company’s or provider’s website, particularly where a specific product, stock or fund is mentioned. Opinions are my own & I regularly get things wrong, so do your own due diligence & seek professional advice before investing your money.
Since Bill Bengen’s study on this approach back in the 90s, some variation of his 4% Rule is often used in Monte Carlo simulations to see if a retiree’s portfolio is capable of outliving the retiree. While some just look at the high market returns of recent years & suggest that we can withdraw at a far higher rate, there are others who suggest that even the 4% withdrawal rate might be too high to use going forward. Who is right?
As I get closer to retirement, I’d love to buy a basket of funds yielding 8 or 10% & live high on the hog with those juicy distributions all the way to the end. But I probably won’t do that. Here, I’m going to use 4 funds that have been around for more than 25 years to illustrate why it might be worth paying attention to the 4% Rule. I’m using a mix of American & Canadian funds. I’m ignoring the currency differences, the tax implications, & many other things but, despite that, I think this example will illustrate some interesting points. Many of the newer funds are too new to have much history to look at, but SPY (SPDR® S&P 500® ETF Trust), XIU (iShares® S&P/TSX 60® Index ETF), CLM (Cornerstone Strategic Value Fund, Inc.®), & FBNDX (Fidelity® Investment Grade Bond Fund) all have some history behind them. Indeed, the S&P 500® Index is often used as the benchmark that other funds are measured against. And very few can outperform this index, for total return, over the long haul.
For this example, we’ll look at four retirees with a million dollar investment in each of those funds. And we’ll start the exercise with some folk who retired at the beginning of 2020. That $1m is more than the average Canadian retirement savings, by the way, but it’s a nice round number for doing mental math. Each retiree withdraws 4% in the first year & increases that amount by the rate of inflation (US inflation numbers used for all) for each subsequent year. Why that approach? Because the portfolio income stream then compensates for inflation in a manner similar to OAS & CPP. Income will be able to keep pace with the increasing cost of groceries, gas, rent, etc. Going from 2020 up to the end of 2023, the income stream would grow from $40k to just under $48k for all four portfolios. All good, considering the higher inflation rates of recent years. After those withdrawals, the underlying portfolio values at the end of the period are SPY ($1.37m), XIU ($1.21m), CLM ($1.18m), & FBNDX ($830k). All four portfolios delivered exactly the same income stream, but the underlying value of all the equity funds went up. While the bond portfolio lost value. But don’t give up on bonds just yet, we’re not done!
As a side note, the idea that we can just live off the distributions feels great, but it doesn’t always work. CLM would have delivered huge distribution cashflows, almost $200k in the first year. But if we sucked everything out along the way the underlying fund value would have dropped to about $641k at the end of 2023. And the total distribution for 2023 would have dropped to $131k. Those are not desirable trends. On the other hand, all the other funds would have distributed too little income & selling some shares to boost income to the 4% level would have been required. I know retirees don’t like having to sell shares for income but, for the rest of this example, we’re going to stick with the approach of reinvesting all the dividends & distributions throughout the year. And then selling shares equivalent to the annual income requirement going into the next year.
Now let’s back it up to retirees starting this whole process in 2015. At the end of 2023, they have been retired for 9 years in this scenario. All portfolios delivered the 4% income stream, indexed to inflation, so that income went from $40k at the beginning, to $52.3k at the end. Ending portfolio values were SPY ($2.05m), XIU ($1.36m), CLM ($1.6m), & FBNDX ($760k). SPY put in a stellar performance over this time, the SPY retiree might be adding a luxury cruise or a boat to the retirement bucket list now, eh! CLM, the high yield fund, outperformed the Canadian index by a nice amount, while the poor bond fund took it in the teeth again.
Next, we’ll jump back another 5 years, to start the process in 2010. Once again, income increased for all portfolios, going from the starting $40k up to $56.8k in the final year. Portfolio values at the end were SPY ($4.00m), XIU ($1.62m), CLM ($1.09m), FBNDX ($799k). OMG (that’s not a ticker symbol!), I wish I could go back in time & stick everything into an S&P 500® Index fund! It looks so good, we should just go all in & look forward to retirement, eh? Not so fast!
For retirees starting in 2005, the income stream would grow from $40k at the beginning, to $64.5k at the end. The portfolio values at the end of this time period are SPY ($2.72m), XIU ($2.28m), CLM ($77k), FBNDX ($637k). That’s a bit of a shocker, CLM is almost wiped out this time. I should point out that American investors can reinvest the CLM distributions at the lower of Net Asset Value or market value. I’m not sure how much this would improve the results for a US investor. But this is focused on Canadians & we can’t do that. Instead, we would have suffered from the significant drawdowns in 2007 & 2008. Those impacted CLM’s value from that point forward. Over this time period, the Canadian fund didn’t look so bad against the American index. And the bond fund, though it lost value, is still hanging in there & delivering income 19 years later. It’s also notable that investing in SPY five years earlier resulted in a significantly lower end portfolio value today, than we had in the last pass. While XIU, under its market conditions, did comparatively better by starting earlier.
One last entry point, this time we’ll start in the year 2000. It’s the same story for starting out with a $40k income, gradually increasing in line with inflation. But the first-pass results only go up to 2014, not our 2023 end point. Because CLM went to $0 in 2014! The dot-com bubble bursting in 2000 hurt all the equity funds for a couple or three years after the bubble burst, but CLM took it hardest. When it got hit again in 2007 & 2008, there just wasn’t enough gas left in the tank to support the 4% withdrawal guideline & it went to zero. Here are the portfolio values at the end of 2014 … SPY ($464k), XIU ($1.19m), CLM ($0.00), FBNDX ($1.22m). That’s pretty interesting now. The American index is seriously suffering & it’s been well surpassed by the Canadian Index. And who knew bonds were so useful. Over this time period, when some pretty bad stuff was happening in the markets, FBNDX was the best performing fund of the bunch!
Let’s do one more run, but without CLM this time. All the remaining portfolios survived up to today & they delivered an income stream that grew from $40k back in 2000, up to $72.9k in 2023. Job done on the income front. Portfolio values at the end of 2023 were SPY ($327k), XIU ($1.50m), FBNDX ($850k). Over this 24 year period, given the withdrawal schedule, the Canadian index fund was a clear winner for end value. And while the bond fund also did well, the American index underperformed. This might be unimaginable for an investor who’s been getting rich on the S&P 500® Index over the past decade & a half. Interestingly, if no withdrawals were being made (an accumulator’s portfolio, rather than a retiree’s portfolio), SPY would have a value of $5.0m at the end of 2023, compared to XIU at $4.7m, & FBNDX at $2.64m. The timing of withdrawals over different timelines & under different market conditions can seriously impact end values. That’s the sequence of returns risk that retirees worry about.
Just for fun, let’s look at a couple of time periods where we start with a 10% withdrawal rate. That means that the million dollar portfolio starts out with a $100,000.00 income stream, increasing by the rate of inflation thereafter. If we begin in 2000, CLM went to zero in 2006. SPY went to zero in 2007. XIU went to zero in 2010. FBNDX went to zero in 2012. None of these portfolios survived more than 13 years. Let’s be real here, the period from 2000 to 2010 was a bad one. But nobody knows when the next bad decade will arrive. If we leapfrog that terrible decade & start in 2010, CLM delivers that $100k+ income stream up to 2019. FBNDX expires in 2021. XIU dies in 2023. Only SPY survives ’til the end of 2023 & the portfolio is still worth $1.68m at that withdrawal rate. Makes for great retirement guesswork, sorry planning, when we do this for ourselves, eh!
On every funds’ website & literature, you’ll find a line about past performance not being of any use in predicting future performance. While that is 100% true, that does not mean that we can’t learn something from historical performance. And this little exercise highlights a few things that should make us pause & think.
One of the most important insights for retirees is that a high withdrawal rate, or living off a high yield, is a bet on good returns over the course of that retiree’s retirement timeline. And it is a bet that the retiree won’t be hit by sequence of returns risk, where an early big hit hurts the durability of the portfolio for the rest of the retiree’s, or the portfolio’s, lifespan. It’s also a bet that high inflation won’t destroy portfolio value in the early years. Look, retirement is a bit of a gamble anyway. Most of us have no idea how long we’ll survive. But we would like our portfolios to survive as least as long as we do. It’s all about striking a balance between living the good life in the go-go years. And, should it be necessary, having enough money for a long term care home at the back end. Everyone’s situation is different too. Some retirees will have a bigger & more secure income from OAS, CPP & company pensions than others. Leaving something for the kids will be important to some, but not for all. There are many factors that can influence withdrawal rates. But all retirees will want their portfolio to survive to the end. Now these sample “portfolios” won’t represent the typical well-balanced or well-diversified portfolio of the average Canadian retiree. However, that wasn’t the point of the exercise. It’s more about thinking cautiously. And using the lessons of history to guide an appropriate level of caution when it comes to withdrawal rates.
Despite Warren Buffet’s advice to just buy an American index fund (& there may be nothing wrong with just owning an S&P 500®Index fund for a 100 year investing horizon!), it might not be an appropriate sole holding based on the real retirement timeline for many retirees. While we would all love to have a high yielding portfolio that delivers steady income, going all in on high income funds may not be the solution for everyone either. It’s worth comparing the total return of any such funds against a selection of domestic & international equity & bond index funds. It’s hard to beat index funds for total return. And if the index funds can’t always guarantee the 4% income stream over a long retirement, then living off the proceeds of a fund that yields 10% might not be viable over the long haul either. Compare the total return performance over a long enough timeline to see if the fund is outperforming the market index funds by enough to justify the higher withdrawal rate. Through good times & bad. If it’s not, then caution is warranted. That doesn’t mean that such funds have no place in a portfolio. There may well be a justification for adding a little income boost in the go-go years, for example. But it does require some careful assessment. After all, it’s never a bad thing to cover your donkey (😜)! In case the markets deliver some negative surprises at the wrong time. Or if retirement goes on for longer than your portfolio expects!
At the end of this exercise, all we can really take away is that the 4% Rule might serve as a good baseline to assess the durability of our retirement income stream. Retire at the right time & we might get away with a far larger withdrawal rate. Retire at the wrong time & even a 4% withdrawal rate might be challenged. Unfortunately, none of us knows what happens next.
Newer investors should also be cautious about recency bias. The outstanding performance of the S&P 500® over the past decade & a half might, or might not, continue. The performance of bonds in 2022 was so bad that some newer investors are avoiding bonds altogether. Note that the original study that created the 4% Rule was based on a 50:50 portfolio of US stocks & bonds. However, there are times when international markets outperform the US. The Canadian market outperformed the US market from 2000 to 2010. Many new high yield funds are considered safe because the underlying holdings are blue chip companies. Just remember that a bad baker can start out with great ingredients & still bake a lousy pie! Only time will tell which of these fund managers will be able to deliver a good total return from these newer income funds. And even for those with a market-matching, or even with a market-beating, performance, taking all the distributions for living income may not allow the portfolio to survive over the course of a long retirement. And finally, all our circumstances are different. A retiree with a lower expected number of years in retirement might withdraw more aggressively. One with a greater life expectancy, & with a goal of leaving lots to the kids, might play a far more conservative game.
Since my crystal ball is broken, I think I’ll be sticking closer to a 4% withdrawal rate when my retirement day rolls around. If you know how to do better, please let me know.
For some, all this may be too challenging to manage. Despite the fees involved, there is nothing wrong with paying a professional to manage your portfolio for you. And to manage the retirement income stream throughout retirement. For some, that will be a good choice. Though figuring out how to choose a good financial advisor has its challenges too.
If you want to learn more about all this from the ground up, I’d like to suggest that you check out Double Double Your Money, available at your local Amazon store.
Important – this is not investing, tax or legal advice, it is for entertainment & thought-provoking purposes only. Data may not be accurate. Check the current & historical data carefully at each fund’s website. Opinions are my own & I regularly get things wrong, so do your own due diligence & seek professional advice before investing your money.
Compounding confounds & confuses the best of us sometimes. It feels like having a bigger yield to DRIP should work better than waiting for the share price to grow, right? After all, turning on the DRIP on a higher yielding ETF means we’re buying far more shares with every dividend or distribution payout. And that’s true, we are buying more shares with a bigger yield. But that does not mean that it outpaces the compound growth that happens within the share price of a lower yielding fund. Compounding is compounding, regardless of where it occurs. And in a growth stock, or in an ETF filled with growth stocks, the compounding is done by stealth, inside the share price. Not via a distribution. And that does not take away its compounding power. It may even add to it.
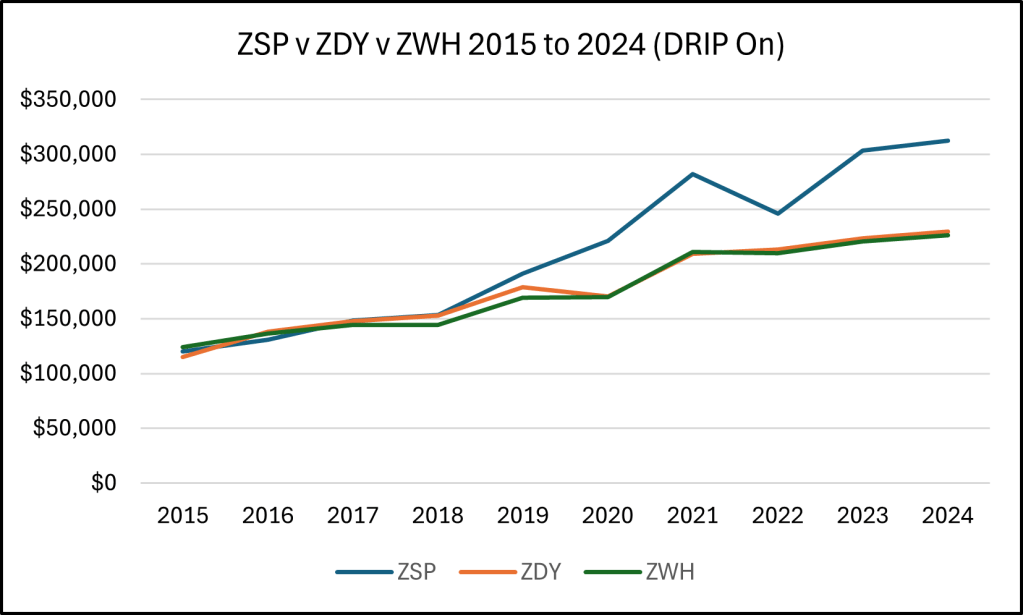
I’m a big fan of their funds, so let’s look at three from the BMO stable for this exercise. ZSP is their S&P 500® Index tracker, ZDY is BMO’s US Dividend ETF, & ZWH is the BMO US High Dividend Covered Call ETF. Here’s what the total returns look like for each, with DRIP on …
I like all three of these funds. ZSP has the lowest yield, typically ranging from about 1.5 to 2%. ZDY has generally floated between 2.5 & 3.5% over the years, while ZWH targets about 6%, give or take a little. The old adage holds true, it’s tough to beat the index fund. ZSP turned $100k into almost $313k over this timeline. ZDY managed to deliver an end value of almost $230k, while ZWH finished at just over $226k. That’s a very respectable comparative return for a covered call ETF.
Despite the positive performance of all these ETFs, the lowest yielding ETF provided the greatest total return. Okay so we know this already, eh? But the confusion tends to increase when we get around to talking about selling shares for income. That strikes fear into the heart of every retiree, even those who can do the math. After all, we’re selling off some of our little geese that lay those golden eggs for us, eh! Here’s what that looks like for these three ETFs …
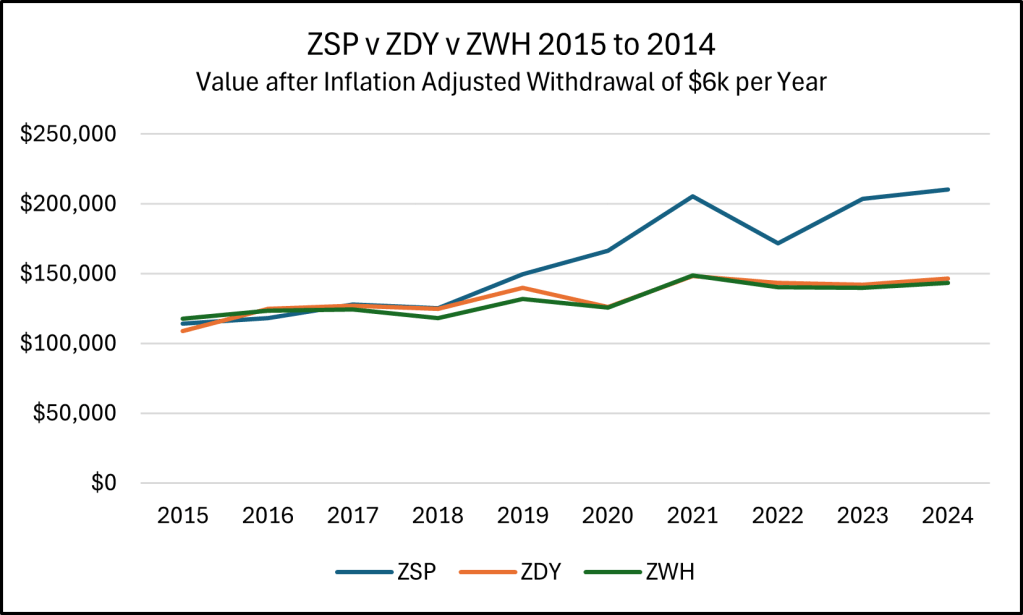
To level the playing field, I used a $6k withdrawal in Year 1 for all three funds, & adjusted for inflation annually in the following years. What remains is each fund’s value after an identical withdrawal. That withdrawal rate approximately matches the higher average distribution rate available from ZWH. ZWH is the only fund of the three that could have avoided selling shares to supply that level of income over this time. However, despite having to sell more shares, the end value of ZSP is $210k. That is significantly more than the $146k remaining in ZDY, & the $143k in ZWH. Despite having to sell more shares to meet the income requirement, the lower yielding funds did better over these years.
Compound growth is just as magical as compound interest or DRIP-driven compound growth. Perhaps it’s even more magical because it doesn’t feel right that you could continue to do better with an ever-declining share count. For better or worse, numbers don’t really care about our feelings!
While the index fund won out over this timeline, there is the potential to have market conditions where a covered call fund might do better. You’ll notice that the ZSP line dips below that of ZWH in 2015 & 2016. Had those market conditions prevailed, ZWH might have continued to lead. They didn’t & ZSP took the lead again. And it stayed ahead through to 2024. While the past doesn’t predict the future, the general tendency for growth in the market suggests that a more growth oriented index fund is likely to outperform over the long haul. Even the bigger downdraft of the index ETF in 2022 wasn’t enough to drag it back down to the level of the other two. During the accumulation phase, it’s all about building the biggest portfolio before retirement. In the decumulation phase, it’s all about portfolio survival!
SOME WORDS OF CAUTION! This comparison is done over a very short, but generally successful, period of performance for the American markets. I started with a $6k withdrawal rate for this example, to approximate the 6% yield of the highest yielding ETF. But I do not think this is an appropriate withdrawal rate to use for retirement planning. There are reasons why professionals use the 4% Rule in Monte Carlo simulations. It allows for a better hypothetical portfolio survival rate under a greater variety of market conditions. In addition, they may even introduce some additional curtailment or flexibility guidelines to a retirement plan, so that a portfolio survives better during down periods. The caution here is that converting everything to high yield funds in retirement might not provide the best outcome if there are tough times ahead. No question, there are times when it may have worked well. But there is greater exposure to catastrophe if things don’t work so well going forward. For example, things would have looked very different for a retiree trying to do this starting in the year 2000. Even with an index fund. I used SPY to look at this &, starting with a $6k withdrawal. The portfolio would have gone to zero by 2012. If the withdrawal started at $4k, or 4% of the original portfolio, it will still be delivering income today. Would a covered call ETF have fared better then? I don’t know, many of today’s funds weren’t around back then. They are too new to assess how they might navigate turbulent markets like those of the lost decade. But having a big yield doesn’t always protect the value of the underlying assets. Choose your retirement strategy with great caution.
If you want to learn more about all this from the ground up, I’d like to suggest that you check out Double Double Your Money, available at your local Amazon store.
Important – this is not investing, tax or legal advice, it is for entertainment & educational purposes only. Data may not be accurate, check the current & historical data carefully at each fund’s website. Opinions are my own, so do your own due diligence & seek professional advice before investing your money.
This isn’t quite hockey but, regardless of the sport, we like to beat our neighbours to the south on the field of battle! When it comes to investing, it’s tough to beat the national teams of either country. And low-cost index funds for both the US & Canadian markets are a bit like the national investing teams. The outstanding performance of the American S&P 500® index in recent years has been impressive. Recency bias might suggest we stick with the winner. However, there are no guarantees that it will work the same way going forward. At least not for the potentially shorter timeframe that some retirees might need it to. People loved this American index in the 90s too. In January 1994, if you had invested a million dollars in SPY (the SPDR® S&P 500® ETF Trust from State Street Global Advisors), with all distributions reinvested, it would have turned into more than $3.6 million by August of 2000. That’s pretty astounding growth, eh? Who wouldn’t want a piece of that action!
Imagine Andy retiring in January 2000. He’s got a million dollars to invest for retirement &, based on its recent performance, he sticks it all into SPY. His sister, Anita, prefers to stick with Canada & she puts a million into XIU, the iShares® S&P/TSX 60 Index® ETF. They both have some government pension income but they need their investment portfolio to provide an additional $40k a year for a comfortable retirement. That’s conveniently aligned with the withdrawal rate of Bill Bengen’s 4% Rule. This rule is more a guideline, but the idea is to plan on the money lasting ’til Andy & Anita move on from this earth. While $40k is 4% of the portfolio in the first year, they both want to increase that income every year by just enough to keep pace with inflation. In addition, rather than run the portfolio down to zero, they would both prefer to leave a little something for their heirs. With both siblings retiring at the start of the new millennium, let’s see how that plays out.
Fortunately, both portfolios have survived up to today & they are both enjoying their golden years. More importantly, they were both able to withdraw an increasing amount each year, in line with inflation. Most recently, they were both able to withdraw almost $73k for living expenses in 2023. The strategy worked for both funds. Today, the value of Andy’s American portfolio is a hair under $326k. While Anita’s Canadian portfolio is worth a little over $1.5 million. Andy’s portfolio showed a money weighted rate of return of about 3.34%. Anita’s was 6.06%. You can get some further insight on MWRR (Money Weighted Rate of Return) here. As a side note on the potential benefits of diversification, a portfolio of 50% allocated to each of these index funds, & rebalanced annually, would have a portfolio value just short of $1.1 million today. But the end result is interesting, eh! Who’d have thought that the less diversified, less growth oriented, Canadian market fund would have outperformed one of the best indices on the planet?
That’s just one snapshot in time, however, & it included SPY taking a bigger hit when the dot-com bubble burst in 2000. And it took another huge hit with the financial crisis that occurred around 2008. That’s a great example of the sequence of returns risk that retirees worry about. If the first few years of retirement are bad, the longer term outlook might not be as rosy. At least not for the kids hoping for a big inheritance!
Things can look different with even a short change in the timeline though. If the guys had invested their million dollars at the start of 2002, for example, Andy’s portfolio value would be worth $2.3 million today. While Anita’s would be at $2.46 million. The 50/50 portfolio would be just over $2.5 million. Just missing the worst of the dot-com bubble bursting made a big difference to the relative performance of SPY over this slightly later timeline. Missing the dot-com crash made a huge difference for the American fund.
For this final example of a traditional balanced portfolio, I used a 40% allocation to FBNDX, the Fidelity® Investment Grade Bond Fund, as this is one of the older bonds funds available for comparison. The remaining 60% was equally divided between SPY & XIU. The annual income remained the same for all three since January 2000, & the balanced portfolio is worth just over $1.2 million today. That compares to the $326k for SPY & the $1.5 million for XIU that we looked at previously. If we look at the 2002 start date, the resulting values are $1.7 million for the 60/40 portfolio, $2.3 million for SPY, & $2.46 million for XIU. The bonds helped when things went off the rails for SPY, but the bond allocation hurt the long term returns once we got past the dot-com bubble bursting.
That’s all just history though. And it’s difficult to interpret what’s going on today in light of that history. Is the American index overvalued? Maybe, but that doesn’t mean it can’t go up more. And there may, or may not, be another lost decade in sight for the American index during our retirement years. Will the Canadian index continue to do it’s boring trudge upward? Possibly. But that’s not guaranteed either. They could both continue to go up. Or down. Some crazy event might impact one or both markets in the future. Would adding some developed & emerging market diversity help? Again, possibly, but there are no guarantees. Despite bonds taking a dive at the same time as the markets in 2022, is there a place for bonds in a portfolio? I think there is. Does a cash position make sense with today’s higher interest rates? Again, I think it probably does. Particularly for those going into retirement. But in what proportion is anyone’s guess & the allocation may be more appropriately decided on based on individual risk tolerance. There are studies that suggest that stocks are less risky than bonds over the long haul. But if the long haul data is looking at a 50 or 100 year time period, that may not help a retiree with a 20 or 25 year retirement span. Especially if a major event hurts market returns during the early decumulation years.
With investing there are always more questions than answers. And the answers will be different for each of us. There are a wide range of solutions offered to help with such problems these days. There are relatively low-cost, all-in-one, asset allocation ETFs now, for example. These are ETFs consisting of globally diversified equities, combined with a weighted allocation to bonds, based on the investor’s risk tolerance. But it’s also possible to make a case for buying such funds individually, rather than in the all-in-one basket. Some retirees prefer income generating assets. Other prefer to leave it all in the hands of a professional money manager. There is no one way to do this. And the vagaries of time and the markets will always produce different results over different timelines.
I wish there was one right answer to this question. But the purpose of this post is more about using the lessons of history to counter the influence of recency bias. While betting big on the currently successful US index may pay off, doing that has delivered some hurt in the past. In other words, if you can tolerate the potential pain, you may achieve the gain you want. Though you may have to live longer to appreciate the results! Asset allocation & diversification can be of value in mitigating those effects. For better or worse. A younger investor with the right risk tolerance may be in a position to take on more risk. Older investors, maybe not so much.
If you want to learn more about all this from the ground up, I’d like to suggest that you check out Double Double Your Money, available at your local Amazon store.
Important – this is not investing, tax or legal advice, it is for entertainment & educational purposes only. Data may not be accurate, check the current & historical data carefully at each fund’s website. Opinions are my own, so do your own due diligence & seek professional advice before investing your money.