Compounding confounds & confuses the best of us sometimes. It feels like having a bigger yield to DRIP should work better than waiting for the share price to grow, right? After all, turning on the DRIP on a higher yielding ETF means we’re buying far more shares with every dividend or distribution payout. And that’s true, we are buying more shares with a bigger yield. But that does not mean that it outpaces the compound growth that happens within the share price of a lower yielding fund. Compounding is compounding, regardless of where it occurs. And in a growth stock, or in an ETF filled with growth stocks, the compounding is done by stealth, inside the share price. Not via a distribution. And that does not take away its compounding power. It may even add to it.
I’m a big fan of their funds, so let’s look at three from the BMO stable for this exercise. ZSP is their S&P 500® Index tracker, ZDY is BMO’s US Dividend ETF, & ZWH is the BMO US High Dividend Covered Call ETF. Here’s what the total returns look like for each, with DRIP on …
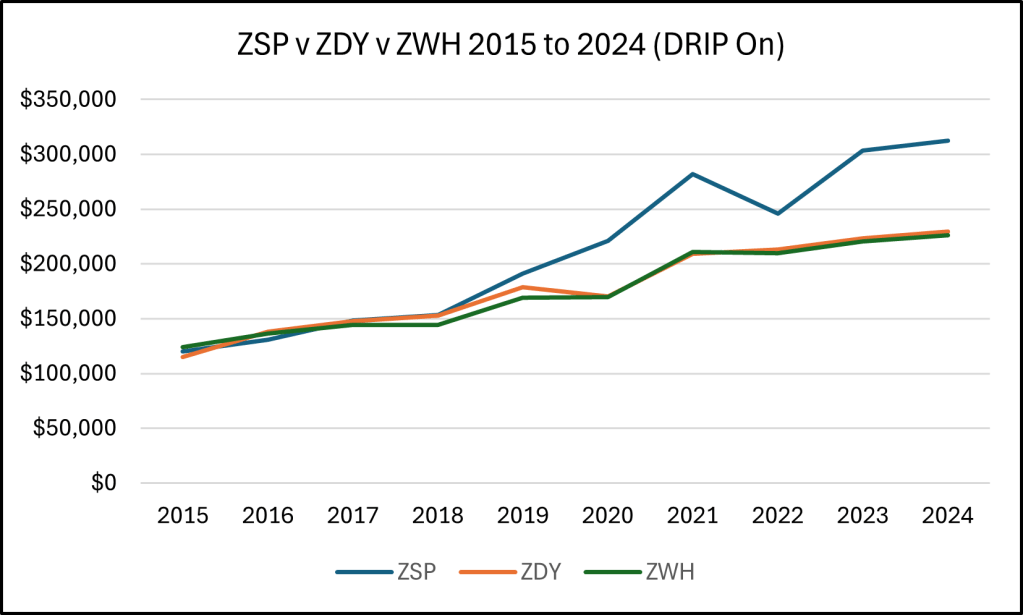
I like all three of these funds. ZSP has the lowest yield, typically ranging from about 1.5 to 2%. ZDY has generally floated between 2.5 & 3.5% over the years, while ZWH targets about 6%, give or take a little. The old adage holds true, it’s tough to beat the index fund. ZSP turned $100k into almost $313k over this timeline. ZDY managed to deliver an end value of almost $230k, while ZWH finished at just over $226k. That’s a very respectable comparative return for a covered call ETF.
Despite the positive performance of all these ETFs, the lowest yielding ETF provided the greatest total return. Okay so we know this already, eh? But the confusion tends to increase when we get around to talking about selling shares for income. That strikes fear into the heart of every retiree, even those who can do the math. After all, we’re selling off some of our little geese that lay those golden eggs for us, eh!
Here’s what that looks like for these three ETFs …
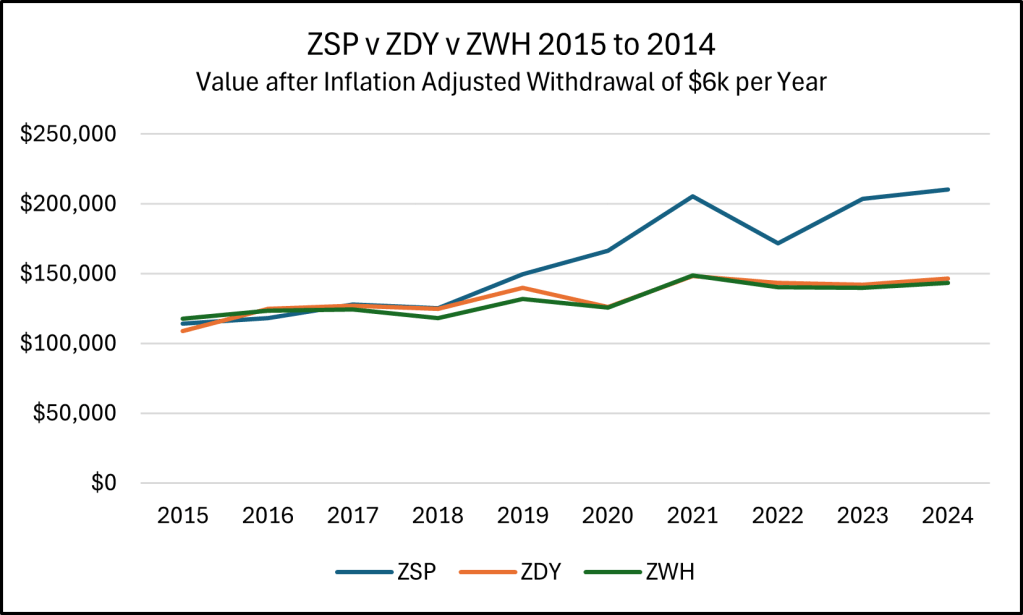
To level the playing field, I used a $6k withdrawal in Year 1 for all three funds, & adjusted for inflation annually in the following years. What remains is each fund’s value after an identical withdrawal. That withdrawal rate approximately matches the higher average distribution rate available from ZWH. ZWH is the only fund of the three that could have avoided selling shares to supply that level of income over this time. However, despite having to sell more shares, the end value of ZSP is $210k. That is significantly more than the $146k remaining in ZDY, & the $143k in ZWH. Despite having to sell more shares to meet the income requirement, the lower yielding funds did better over these years.
Compound growth is just as magical as compound interest or DRIP-driven compound growth. Perhaps it’s even more magical because it doesn’t feel right that you could continue to do better with an ever-declining share count. For better or worse, numbers don’t really care about our feelings!
While the index fund won out over this timeline, there is the potential to have market conditions where a covered call fund might do better. You’ll notice that the ZSP line dips below that of ZWH in 2015 & 2016. Had those market conditions prevailed, ZWH might have continued to lead. They didn’t & ZSP took the lead again. And it stayed ahead through to 2024. While the past doesn’t predict the future, the general tendency for growth in the market suggests that a more growth oriented index fund is likely to outperform over the long haul. Even the bigger downdraft of the index ETF in 2022 wasn’t enough to drag it back down to the level of the other two. During the accumulation phase, it’s all about building the biggest portfolio before retirement. In the decumulation phase, it’s all about portfolio survival!
SOME WORDS OF CAUTION!
This comparison is done over a very short, but generally successful, period of performance for the American markets. I started with a $6k withdrawal rate for this example, to approximate the 6% yield of the highest yielding ETF. But I do not think this is an appropriate withdrawal rate to use for retirement planning. There are reasons why professionals use the 4% Rule in Monte Carlo simulations. It allows for a better hypothetical portfolio survival rate under a greater variety of market conditions. In addition, they may even introduce some additional curtailment or flexibility guidelines to a retirement plan, so that a portfolio survives better during down periods. The caution here is that converting everything to high yield funds in retirement might not provide the best outcome if there are tough times ahead. No question, there are times when it may have worked well. But there is greater exposure to catastrophe if things don’t work so well going forward.
For example, things would have looked very different for a retiree trying to do this starting in the year 2000. Even with an index fund. I used SPY to look at this &, starting with a $6k withdrawal. The portfolio would have gone to zero by 2012. If the withdrawal started at $4k, or 4% of the original portfolio, it will still be delivering income today.
Would a covered call ETF have fared better then? I don’t know, many of today’s funds weren’t around back then. They are too new to assess how they might navigate turbulent markets like those of the lost decade. But having a big yield doesn’t always protect the value of the underlying assets. Choose your retirement strategy with great caution.
If you want to learn more about all this from the ground up, I’d like to suggest that you check out Double Double Your Money, available at your local Amazon store.
Important – this is not investing, tax or legal advice, it is for entertainment & educational purposes only. Data may not be accurate, check the current & historical data carefully at each fund’s website. Opinions are my own, so do your own due diligence & seek professional advice before investing your money.