Canadian Banks for Dividend or Covered Call Income?

Dollars & Dividends

We love our dividends in Canada. If dividends are so great, why not go for the even greater yields available with covered call ETFs? Maybe we can toss all our investments into covered call ETFs & retire early? That sounds great!
But does it work?

Maybe!

Every investing strategy has its fan base. But at the end of the day, it all comes down to how the numbers work for the individual investor. And covered call ETFs can work for some investors.

However, some features of covered call writing can be less appealing. The notion of covered call ETFs having lower volatility, for example, may be true. But volatility is a measure of an investment going up, as well as down. In general, covered calls will limit upside. If a growing stock is called away, you lose some of the upside. As investors, we don’t mind volatility if it means our investment is going up. We only fret when it goes down. Hand in hand with that is the idea that covered call writing offers some downside protection. You’ll notice the wording in the description of many funds says something like downside protection may be limited to the returns provided by the covered call premium. That’s marketing speak for “we can crash as hard as anything else but you’re at least getting that juicy covered call premium along the way”. Unfortunately, during times of growth or recovery, the capped upside often means that the growth of a covered call fund doesn’t match that of a fund holding the equities directly.

Let’s take a look at an example using only Canada’s big banks. The five largest banks in Canada all started paying dividends in the 1800s. That’s a little too far back to look at, but if you’d invested $100k in an equal-weight holding of the Big 6 banks back in January 2000, that portfolio would have grown to almost one & a half million dollars today! Investing in the large cap American or Canadian market index funds would only have returned under half a million over that time. Of course, nobody would risk going all in on just the Canadian banks. Right!?! But this kind of performance is why Canadians like their banks.

To compare the different investing strategies, I’ll use BMO’s ZEB & ZWB here. Both ETFs are designed to track the Solactive Equal Weight Canada Banks Index. And both funds are managed by BMO Global Asset Management, one of Canada’s largest ETF providers. ZEB just holds the banks. ZWB holds the same banks, but adds a covered call strategy to about 50% of the portfolio to generate a bigger income stream. These ETFs have a relatively short shared history, so we’re only looking at returns over an 11.5 year period up to the middle of this year here.

Accumulation
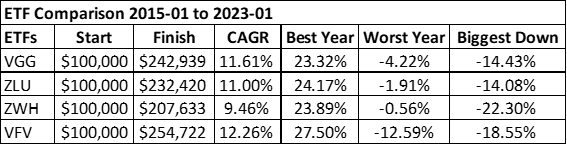
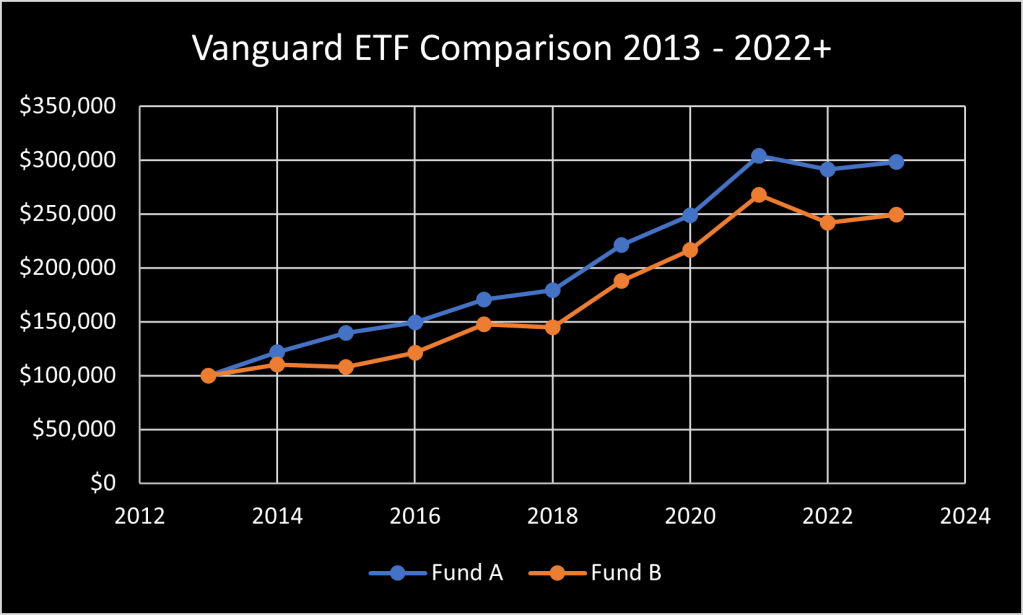
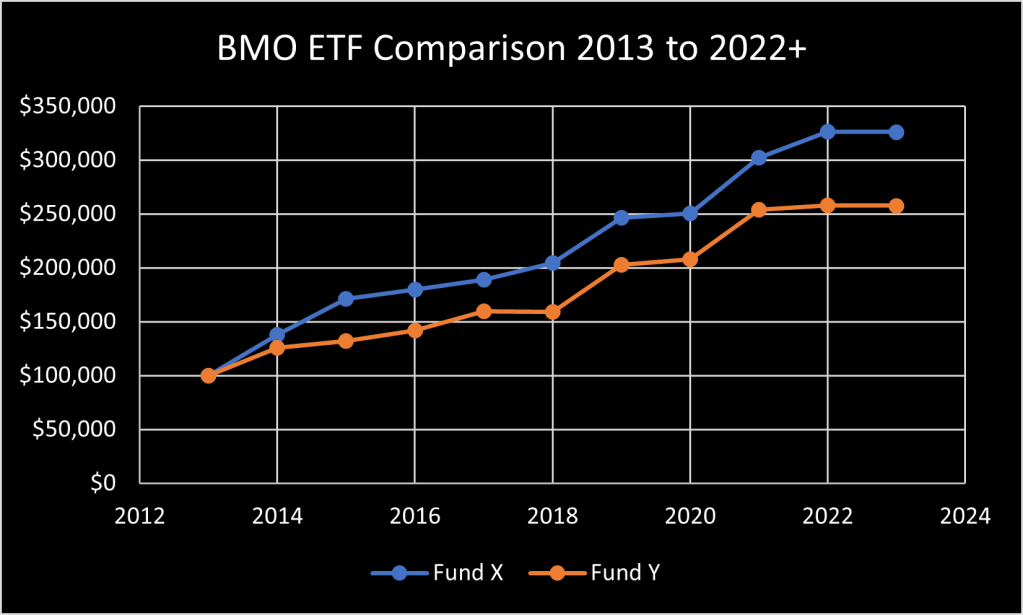
During the accumulation years, all dividends & distributions are reinvested, that’s the “DRIP ON” scenario in the table below. This shows the Total Return, with dividends reinvested, from a $100k investment directly in the bank stocks. And it compares that to the same $100k investment in ZEB & ZWB.

It’s probably no surprise that directly investing in the stocks produced the greatest return. The direct investment was rebalanced semi-annually, to match the index tracking guidelines used by the ETFs. While ZEB does all that work for us, the fees charged by the fund cause a little drag on the returns. Since covered call writing lops off some of the upside potential, it’s also not a surprise to see ZWB trailing the pack here. It’s CAGR & Best Year are poorer. But, it’s worth noting that it’s Worst Year is slightly worse than the other two. Fund managers do warn that covered call funds “may” provide downside protection. Sometimes, that might only be by the amount of the covered call premium. But it’s not a guarantee. Since ZWB had the biggest drop of the three, the covered call strategy didn’t provide much of a safety net during the covid crash of March 2020. It’s possible that longer periods of sideways, or slightly down, markets could have allowed ZWB to produce a better relative performance. All in all though, it’s a pretty good performance for all strategies. That’s the accumulation picture. Next we’ll look at what happens when we start spending the income.

Spending the Money
Things change when we retire & need to spend some of our savings every year. All sorts of new challenges come up. The ideal scenario for many retirees is to have their investments generate enough dividends & distributions for them to live on. No worries about having to sell shares in a down market, & so on. Here’s how these three investments deliver on the income front.

This table shows the picture for an investor who retired in 2012 & sucked out all the dividends & distributions for living expenses along the way. The holder of ZWB would have had more income over the 11.5 year period. Though overall, perhaps not the best value, since the value of the underlying portfolio didn’t grow as much as the other two. If an emergency situation forced the sale of some shares to raise capital, the other two approaches had far bigger portfolio values to draw from. Aside from the income, the positive thing about all these results is that the underlying assets continued to appreciate. All these ETFs show positive CAGR. And this is with all the dividends & distributions taken out. BMO’s limited covered call strategy, over this timeline, worked well. Any income investment that shows negative CAGR for the underlying assets (with DRIP off) might be an exposure for a retiree with a longer time horizon. The portfolio value would decline over time & that will have an impact on the income stream over the long haul too. There is one other exposure here & that is the impact of inflation. If we adjust the End Value of the portfolios in the above table, the Big 6 & ZEB are worth an inflation-adjusted amount of about $150k. The End Value of ZWH, in 2012 dollars, is just under $95k at the end. This isn’t quite accurate, as the inflation adjustment comes from US inflation data, not Canadian. But it still shows the importance of having a portfolio capable of staying ahead of inflation.

Here’s what the income streams look like for these investments …

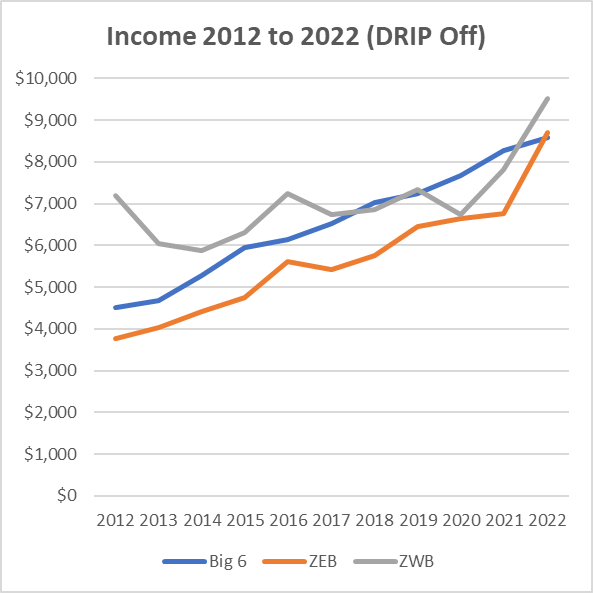
While ZWB starts out with a far greater annual income than the other two options, it shows more variability than the other two. Variability of income from year to year can be an issue for some retirees. Perhaps more importantly, the other income streams are catching up as time goes by. Direct investing shows a more consistent upward trajectory, even without any additional investment or DRIP. And this is exactly what you’d hope for with a portfolio of dividend-growth stocks. The dividend growth is what grows the income stream. That can be very important for an investor with a longer expected time horizon in retirement. Early retirees should watch out for this.

The Canadian banks generally do well over time. For portfolio growth & for growth of income. But now it’s down to personal choice. Do you prefer to trade some long-term portfolio value for the bigger income stream of the covered call approach early in retirement? Or do you like the more consistent growth of the income stream that comes from a portfolio biased towards dividend growth? There are a lot of factors that go into individual decisions. For a young investor with a long time horizon, total return is probably going to be more important than the size of the income stream starting out. It might also be more important for an early retiree. Or for a healthy retiree with a longer life expectancy. Things like leaving an inheritance, planning for home care or a retirement home, & so on, all factor into the decision making process too. Regardless, the Canadian banks have been a pretty solid investment over time & they look good in all these scenarios. Of course, as you’ll find noted on every fund’s webpage … past performance is not indicative of future results! We can’t just assume an investment will continue to do well in the future because it’s done well in the past. The banks have been great performers historically. But not all stocks or funds perform as well as the banks did here. Be sure to compare your choices for total return & income growth. And not just the size of the yield!

If you want to learn more about all this from the ground up, I’d like to suggest that you check out Double Double Your Money, available at your local Amazon store.

Important – this is not investing, tax or legal advice, it is for entertainment & educational purposes only. Opinions are my own, so do your own due diligence & seek professional advice before investing your money.

Why you NEED a TFSA?

According to the latest StatsCan data, from 2021, there are about 15 million of us that have TFSA accounts. There are about 30 million of us that are eligible to have TFSA accounts, so 50% of the adult population are not using this account. While some can’t afford to save & invest, there are still a lot of people missing out on what this account can do for them. TFSA means Tax-Free Savings Account.

Who doesn’t want something tax-free?
If you have money sitting outside this account … WHY!?!

The other funny thing with TFSAs is that a lot of people are storing cash there. I know it says “Savings” right in the name, but parking cash is not what this account is about. Inflation evaporates the value of cash. Especially with today’s high inflation rate. There are no benefits to letting cash evaporate inside a TFSA. You need to invest in something. Even if you are worried about investing in the markets, you can put your money to work in a high interest tax-free savings account (HISA), in GICs, or in one of the cash savings or HISA type ETFs. Some of these are yielding 5% at the moment. You can harvest that 5% return in a TFSA totally tax-free.

Some of these choices are more liquid than others. Being “liquid” means you can convert whatever it’s in to cash right away. And that means you could consider storing some of your emergency fund inside a TFSA. A locked-in GIC, for example, is not suitable for an emergency fund. An emergency can’t wait for a GIC to mature. The bottom line is that it’s tough enough to save, whether it be for an emergency fund or a holiday fund, but reducing the value of those savings by not getting some kind of return is a waste. And not sheltering those returns from tax only adds to that.

I know some of you are are already way ahead of the game with this. But if you have people in your life that you even remotely care for, your friends, your parents, your kids, please teach them about the value of the TFSA. It’s too big a deal to miss out on. Sure they’ll have to learn how it works & what investments are suitable under different circumstances. But it is worth the effort. If they can’t learn enough to do it alone, encourage them to see an advisor for help.

If you are not filling up your TFSA with long-term investments, use the spare room for your spare cash. Let it work tax-free for you.

If you want to learn a whole lot more about how all this stuff works, read Double Double Your Money, available here on Amazon. If you have a Kindle Unlimited subscription, you can read it for free. If you don’t have a subscription, there is a current Amazon.ca promotion that gives you the first two months free, so you really can read it for free. Please read it & share the message. Help get it out to some of the other 15 million Canadians who are missing out on the tax sheltering power of the TFSA.

Important – this is not investing, tax or legal advice, it is for entertainment & educational purposes only. Opinion are my own, do your own due diligence & seek professional advice before investing your money.

Double Double Your Money

I started pulling information together to help my kids save & invest almost 3 years ago & the end result is this …

Double Double Your Money was released on Amazon today.

It is a guide to saving & investing that primarily targets younger investors & those just starting out on their journey. That said, I could have used something like this at a much older age myself! It might also be a useful resource for other parents looking for some ideas on how to guide their own kids towards a saving & investing program. Like all Dads, I’m trying to prevent my kids making some of the mistakes I made. As parents, we know how that usually goes. But we’re parents, so we have to keep trying, eh!

While the broad principles apply in most places, the focus is on Canada, where we can tap the value of tax-sheltered accounts like our TFSA & RRSP. The Canadian CPP & OAS programs provide some support in retirement but there’s a lot more we need to do to for a comfortable retirement. In my twenties, I couldn’t even imagine thinking about retirement. Nor do my kids. So I cover some exciting things like getting rich, becoming a millionaire on minimum wage, early retirement, FIRE, & anything that I think might suck them into saving & investing sooner!

Not to worry, there’s no silly stuff here. I’m a little too conservative & risk-averse for that. And I worry more about losing my kids money than I do my own. But the importance of building a financial strategy as early as possible is a huge deal. I hope this works to get younger investors, including my own kids, motivated enough to get things going.

You’ll find it across most Amazon markets in Kindle & hardcopy formats, & you’ll find it in the Canadian market here.

The Best American ETFs for Canadians

Decisions, Decisions!

If I lived in the US, I would probably split my US exposure between the Schwab US Dividend Equity ETF (SCHD) & the Vanguard Dividend Appreciation Index Fund ETF (VIG).

Why?

For a few reasons. The first is because I like dividend-growth stocks & both those ETFs focus on companies that have the potential to create a growing income stream. Dividend-growth companies appear to hold up better than growth stocks when the markets crash. Because I’m a bit of a chicken, I tend to I favour ETFs with lower volatility than the market. The goal of choosing lower volatility investments is to take away some of the market downside when bad things happen. When a conservative investor seeks to avoid volatility, what we really mean is that we don’t want our stuff to go down. We don’t mind volatility to the upside, of course! But lower volatility ETFs usually knock off some of the highs too. These two ETFs, however, are great performers. One slightly lags the market, while the other has a slight beat. Both provide that level of performance with less volatility than an S&P 500 Index® ETF. Since 2012, they had better annual performance than the market in the worst years & their biggest drawdowns were less severe than those of the market too. The bottom line is they have provided good performance over time. And they offer the potential for reduced anxiety during the bad times. My kind of investing.

While we can buy these ETFs in Canada, there are pros & cons to a Canadian investing through the US exchanges. Some combination of laziness, currency exchange costs, & a desire to avoid additional tax reporting headaches has many Canadian investors favouring Canadian-listed ETFs for their American exposure. Can we do that & get the results provided by ETFs like SCHD & VIG. Let’s take a look.

There are ETFs from all the big providers, like Blackrock®, BMO Global Asset Management, Vanguard Canada, Horizons & others, that provide US market exposure solutions for Canadians. In Canadian dollars. An easy choice for one of the contenders is the Vanguard US Dividend Appreciation Index ETF (VGG). This one is easy because it holds just VIG, the very same US ETF mentioned above. Of course, the expense ratio (fee) is higher in Canada, but we’re used to that, eh! I would like a Canadian-listed equivalent to SCHD, but there really isn’t anything doing exactly what SCHD does up here. BMO’s ZDY is vaguely similar but the BMO Low Volatility US Equity ETF (ZLU) looks interesting too. With all the online chatter about high yield ETFs in recent years, I had to include one of those for comparison & I went with the BMO US High Dividend Covered Call ETF (ZWH). I think this is one of the better ones in this space & it merits inclusion to see if all the talk about the downside protection that this strategy offers is really true.

Let’s cut to the chase …

For the market benchmark comparison, I’m using Vanguard Canada’s S&P 500 Index® ETF (VFV). With everything in Canadian dollars, the variable exchange rate noise doesn’t confuse the comparison. Here we see the results of 100k invested in each of the ETFs at the start of 2015. ZWH was launched in 2014 so the data (courtesy of portfoliovisualiser.com) for this comparison starts in 2015.

What do you think of those results?

As is often the case, the low-cost market index fund wins out for total return. Over a long lifetime of investing, that 1.26% difference between the annual returns from ZLU & VFV, for example, could be huge. If you can tolerate the volatility, Mr. Buffett’s advice is looking good, the low-cost market index fund is the winner. But for more fearful investors, the lower volatility choices might help keep them in the market during times of steep decline. Jumping in & out of the market in response to market fluctuations can be a wealth killer for investors. For that reason, my choices would be VGG & ZLU in this instance. They don’t come as close to market returns as the two American ETFs we looked at earlier. But they’re good enough for me & I think I’d manage a better night’s sleep with those in my portfolio. I must be honest here, I was taken aback by how well ZLU has performed over the past 8 years. Can it sustain this level of performance? I have absolutely no idea. But I am impressed. ZWH was also surprisingly good. Though it shows the best “Worst Year” performance of the four, it had the biggest drawdown of the group, at 22.3%. That would have been a heart-stopper for me. Yet it managed to recover from that big drawdown to post pretty decent results over time. That’s a good outcome. Its total return over the period, however, lags the other two, so I would probably choose those instead. In retirement, when an income stream might be more important, ZWH might earn a place in a portfolio for some.

There’s a lot more under the hood here. Along with deciding on a US portfolio allocation percentage, an investor should consider the diversity of each fund for that US exposure. There are tax implications for US-listed vs Canadian-listed American equities in different accounts, sheltered & not. And so on. This post isn’t about any of that, it’s just an example of tailoring a portfolio to suit an investor profile that might be more, or less, risk tolerant.

What do you do for your US exposure?
And be sure to let me know if you have a suggestion for a better alternative than those above.

Important – this is not investing, tax or legal advice, it is for entertainment & educational purposes only. Opinion are my own, do your own due diligence & seek professional advice before investing your money.


When Stock Charts Lie

Picking Winners from Stock Charts? Don’t do that!

I’m not a very sophisticated investor. When it comes to choosing between two stocks or ETFs, I like to look at pictures. Let me use a couple of funds from one of my favourite fund companies, Vanguard, by way of example. Look at the chart below, which fund would you choose?
Seems like a no-brainer, it’s the blue one all the way, eh? Over the course of 9 years or so, Fund A has outperformed Fund B. Fund B managed to turn 100k into about 250k. But Fund A turned that same 100k into almost 300k. All these charts are with dividends reinvested.

Let’s look at one more, this time from another of my favourite fund companies, BMO Global Asset Management. Similar story here, Fund X is crushing Fund Y. While Fund Y turned 100k into more than 250k, Fund X managed to return over 325k during that same time. Another no-brainer choice, eh?

No, it’s not quite as simple as that.
In fact, the ETFs used in each of these charts are, for all intents & purposes, identical.
So why are the charts suggesting otherwise?

The difference mainly comes from the currency of purchase & the differences in exchange rates over time.
Fund B in the Vanguard chart is VIG, an American-listed dividend appreciation fund & Fund A is a Canadian-list fund, VGG, which only holds … wait for it … VIG, the exact fund that plotted the chart for Fund B. VIG is purchased in US dollars, while VGG is purchased in Canadian dollars.
Fund X is BMO’s Low Volatility US Equity ETF, ticker ZLU, listed on the Canadian exchange. While Fund Y is the US dollar version of exactly the same fund, ticker ZLU-U, also listed on the Canadian exchange. Yes, you can buy funds on the Canadian exchange in US dollars. The apparent outperformance of the funds listed in Canadian dollars is due to the general decline of the value of Canadian dollar against the greenback over those years. The value of the companies in both funds is identical but the numerical value in US or Canadian dollars changes with changes in the currency exchange rate. Back in 2013 you could swap a loonie for about 97 cents American. Today, it’s about 74 cents. That makes for a bigger number in Canadian dollars at the end of the chart. But the relative value is far closer than the charts suggest. If you were cashing in your portfolio to buy a condo in Florida today, your loonies would be exchanged for fewer US dollars than in 2013. Nobody can predict the future of the exchange rate any better than the direction of the stock market but there’s another way to think about it. When the Canadian dollar is strong, Canadians love to go cross-border shopping. Same thing with buying American equities! 😜

So, if you need this kind of market exposure in your portfolio, which funds should you buy?

Simple question but there are a lot of things going on here so the answer is not so simple. The American VIG comes with a 0.06% fee, while the Canadian version charges 0.30%. The Canadian fee is 5 times larger. Though it still looks small, small fees can make a difference over time. The BMO funds both have an MER of 0.33%, so that’s a wash. As Canadians, we’re used to paying more than our American cousins for a lot of things &, unfortunately, that includes fund fees. So why not buy the American-listed fund instead? Again, not so simple. Doing that involves currency exchange fees. Along with the potential for additional tax reporting & liability concerns, of particular concern with larger holdings. To top it off, there are foreign withholding taxes to consider. These can be protected by collecting dividends from American-listed equities inside an RRSP or RRIF, they can be offset in a taxable account, but they are not recoverable in a TFSA. Nor within any tax-sheltered account if the American dividends are coming from a Canadian-listed ETF holding American dividend paying companies. These are all topics for another day but the message for today is this … don’t make your investing decisions based on a random chart you see online. And especially not on the charts above. It’s just not that simple.

Now, you shouldn’t let this paralyse you either. If you’re just starting out, there is nothing wrong with sticking with the path of least resistance. There are no guarantees it will be the same going forward but if past market performance is anything to go by, having an allocation to Canadian-listed Canadian-dollar funds that track an American index should serve you well. If you are saving & investing small amounts regularly, & if you expect to be doing that for many years, you can dollar-cost-average your way through the fluctuations of the currency exchange rate, in addition to those of the market. It’s usually not wise to wait for the “right” currency exchange rate. A lot of market growth potential can be missed while waiting for the right time to invest. If you happen to get a bonus cheque that you want to invest in US equities right when the Canadian dollar is at par, that’s great. Nothing wrong with a bit of luck either! There are other reasons why we might prefer to hold a position in US-listed or US-denominated equities but, in general, any of these funds might work for a part of the US market exposure in a portfolio.
As your portfolio grows, you will almost certainly need some professional advice down the road. Especially when it comes to taxes.

Let me modify the title a bit here: the charts are not purveying lies but they can be deceptive. Do not rely on simple charts to tell the whole story. Charts are more like a good mystery novel. There are so many nuances that you need to dig deeper in order to figure out the plot before you get to the end. And even when you do that, you should always try to prepare for a surprise ending!

Important – this is not investing, tax or legal advice, it is for entertainment & educational purposes only. Opinion are my own, do your own due diligence & seek professional advice before investing your money. Sometimes, I get stuff wrong! Please let me know if you spot any errors, of commission or omission, along the way.