
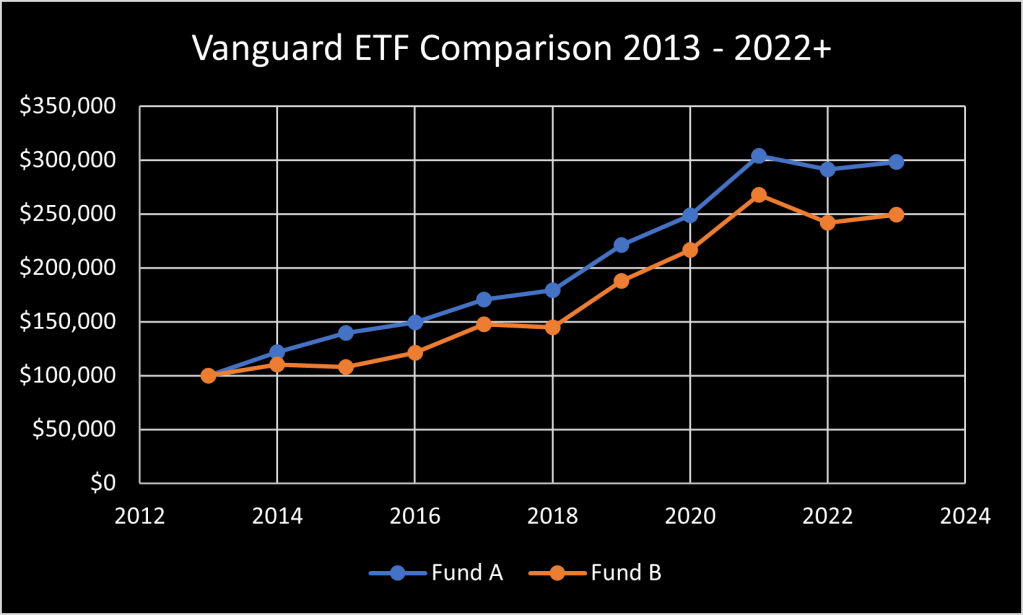
I’m not a very sophisticated investor. When it comes to choosing between two stocks or ETFs, I like to look at pictures. Let me use a couple of funds from one of my favourite fund companies, Vanguard, by way of example. Look at the chart below, which fund would you choose?
Seems like a no-brainer, it’s the blue one all the way, eh? Over the course of 9 years or so, Fund A has outperformed Fund B. Fund B managed to turn 100k into about 250k. But Fund A turned that same 100k into almost 300k. All these charts are with dividends reinvested.
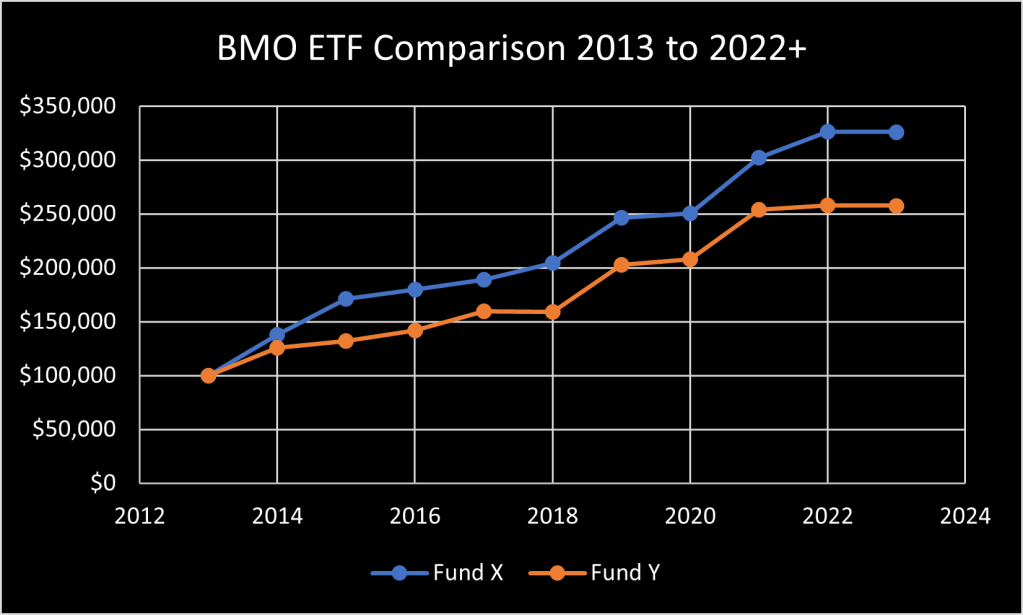
Let’s look at one more, this time from another of my favourite fund companies, BMO Global Asset Management. Similar story here, Fund X is crushing Fund Y. While Fund Y turned 100k into more than 250k, Fund X managed to return over 325k during that same time. Another no-brainer choice, eh?
No, it’s not quite as simple as that.
In fact, the ETFs used in each of these charts are, for all intents & purposes, identical.
So why are the charts suggesting otherwise?
The difference mainly comes from the currency of purchase & the differences in exchange rates over time.
Fund B in the Vanguard chart is VIG, an American-listed dividend appreciation fund & Fund A is a Canadian-list fund, VGG, which only holds … wait for it … VIG, the exact fund that plotted the chart for Fund B. VIG is purchased in US dollars, while VGG is purchased in Canadian dollars.
Fund X is BMO’s Low Volatility US Equity ETF, ticker ZLU, listed on the Canadian exchange. While Fund Y is the US dollar version of exactly the same fund, ticker ZLU-U, also listed on the Canadian exchange. Yes, you can buy funds on the Canadian exchange in US dollars. The apparent outperformance of the funds listed in Canadian dollars is due to the general decline of the value of Canadian dollar against the greenback over those years. The value of the companies in both funds is identical but the numerical value in US or Canadian dollars changes with changes in the currency exchange rate. Back in 2013 you could swap a loonie for about 97 cents American. Today, it’s about 74 cents. That makes for a bigger number in Canadian dollars at the end of the chart. But the relative value is far closer than the charts suggest. If you were cashing in your portfolio to buy a condo in Florida today, your loonies would be exchanged for fewer US dollars than in 2013. Nobody can predict the future of the exchange rate any better than the direction of the stock market but there’s another way to think about it. When the Canadian dollar is strong, Canadians love to go cross-border shopping. Same thing with buying American equities! 😜
So, if you need this kind of market exposure in your portfolio, which funds should you buy?
Simple question but there are a lot of things going on here so the answer is not so simple. The American VIG comes with a 0.06% fee, while the Canadian version charges 0.30%. The Canadian fee is 5 times larger. Though it still looks small, small fees can make a difference over time. The BMO funds both have an MER of 0.33%, so that’s a wash. As Canadians, we’re used to paying more than our American cousins for a lot of things &, unfortunately, that includes fund fees. So why not buy the American-listed fund instead? Again, not so simple. Doing that involves currency exchange fees. Along with the potential for additional tax reporting & liability concerns, of particular concern with larger holdings. To top it off, there are foreign withholding taxes to consider. These can be protected by collecting dividends from American-listed equities inside an RRSP or RRIF, they can be offset in a taxable account, but they are not recoverable in a TFSA. Nor within any tax-sheltered account if the American dividends are coming from a Canadian-listed ETF holding American dividend paying companies. These are all topics for another day but the message for today is this … don’t make your investing decisions based on a random chart you see online. And especially not on the charts above. It’s just not that simple.
Now, you shouldn’t let this paralyse you either. If you’re just starting out, there is nothing wrong with sticking with the path of least resistance. There are no guarantees it will be the same going forward but if past market performance is anything to go by, having an allocation to Canadian-listed Canadian-dollar funds that track an American index should serve you well. If you are saving & investing small amounts regularly, & if you expect to be doing that for many years, you can dollar-cost-average your way through the fluctuations of the currency exchange rate, in addition to those of the market. It’s usually not wise to wait for the “right” currency exchange rate. A lot of market growth potential can be missed while waiting for the right time to invest. If you happen to get a bonus cheque that you want to invest in US equities right when the Canadian dollar is at par, that’s great. Nothing wrong with a bit of luck either! There are other reasons why we might prefer to hold a position in US-listed or US-denominated equities but, in general, any of these funds might work for a part of the US market exposure in a portfolio.
As your portfolio grows, you will almost certainly need some professional advice down the road. Especially when it comes to taxes.
Let me modify the title a bit here: the charts are not purveying lies but they can be deceptive. Do not rely on simple charts to tell the whole story. Charts are more like a good mystery novel. There are so many nuances that you need to dig deeper in order to figure out the plot before you get to the end. And even when you do that, you should always try to prepare for a surprise ending!
Important – this is not investing, tax or legal advice, it is for entertainment & educational purposes only. Opinion are my own, do your own due diligence & seek professional advice before investing your money. Sometimes, I get stuff wrong! Please let me know if you spot any errors, of commission or omission, along the way.
